Using Data Visualizations to Reinforce Ecopedagogy
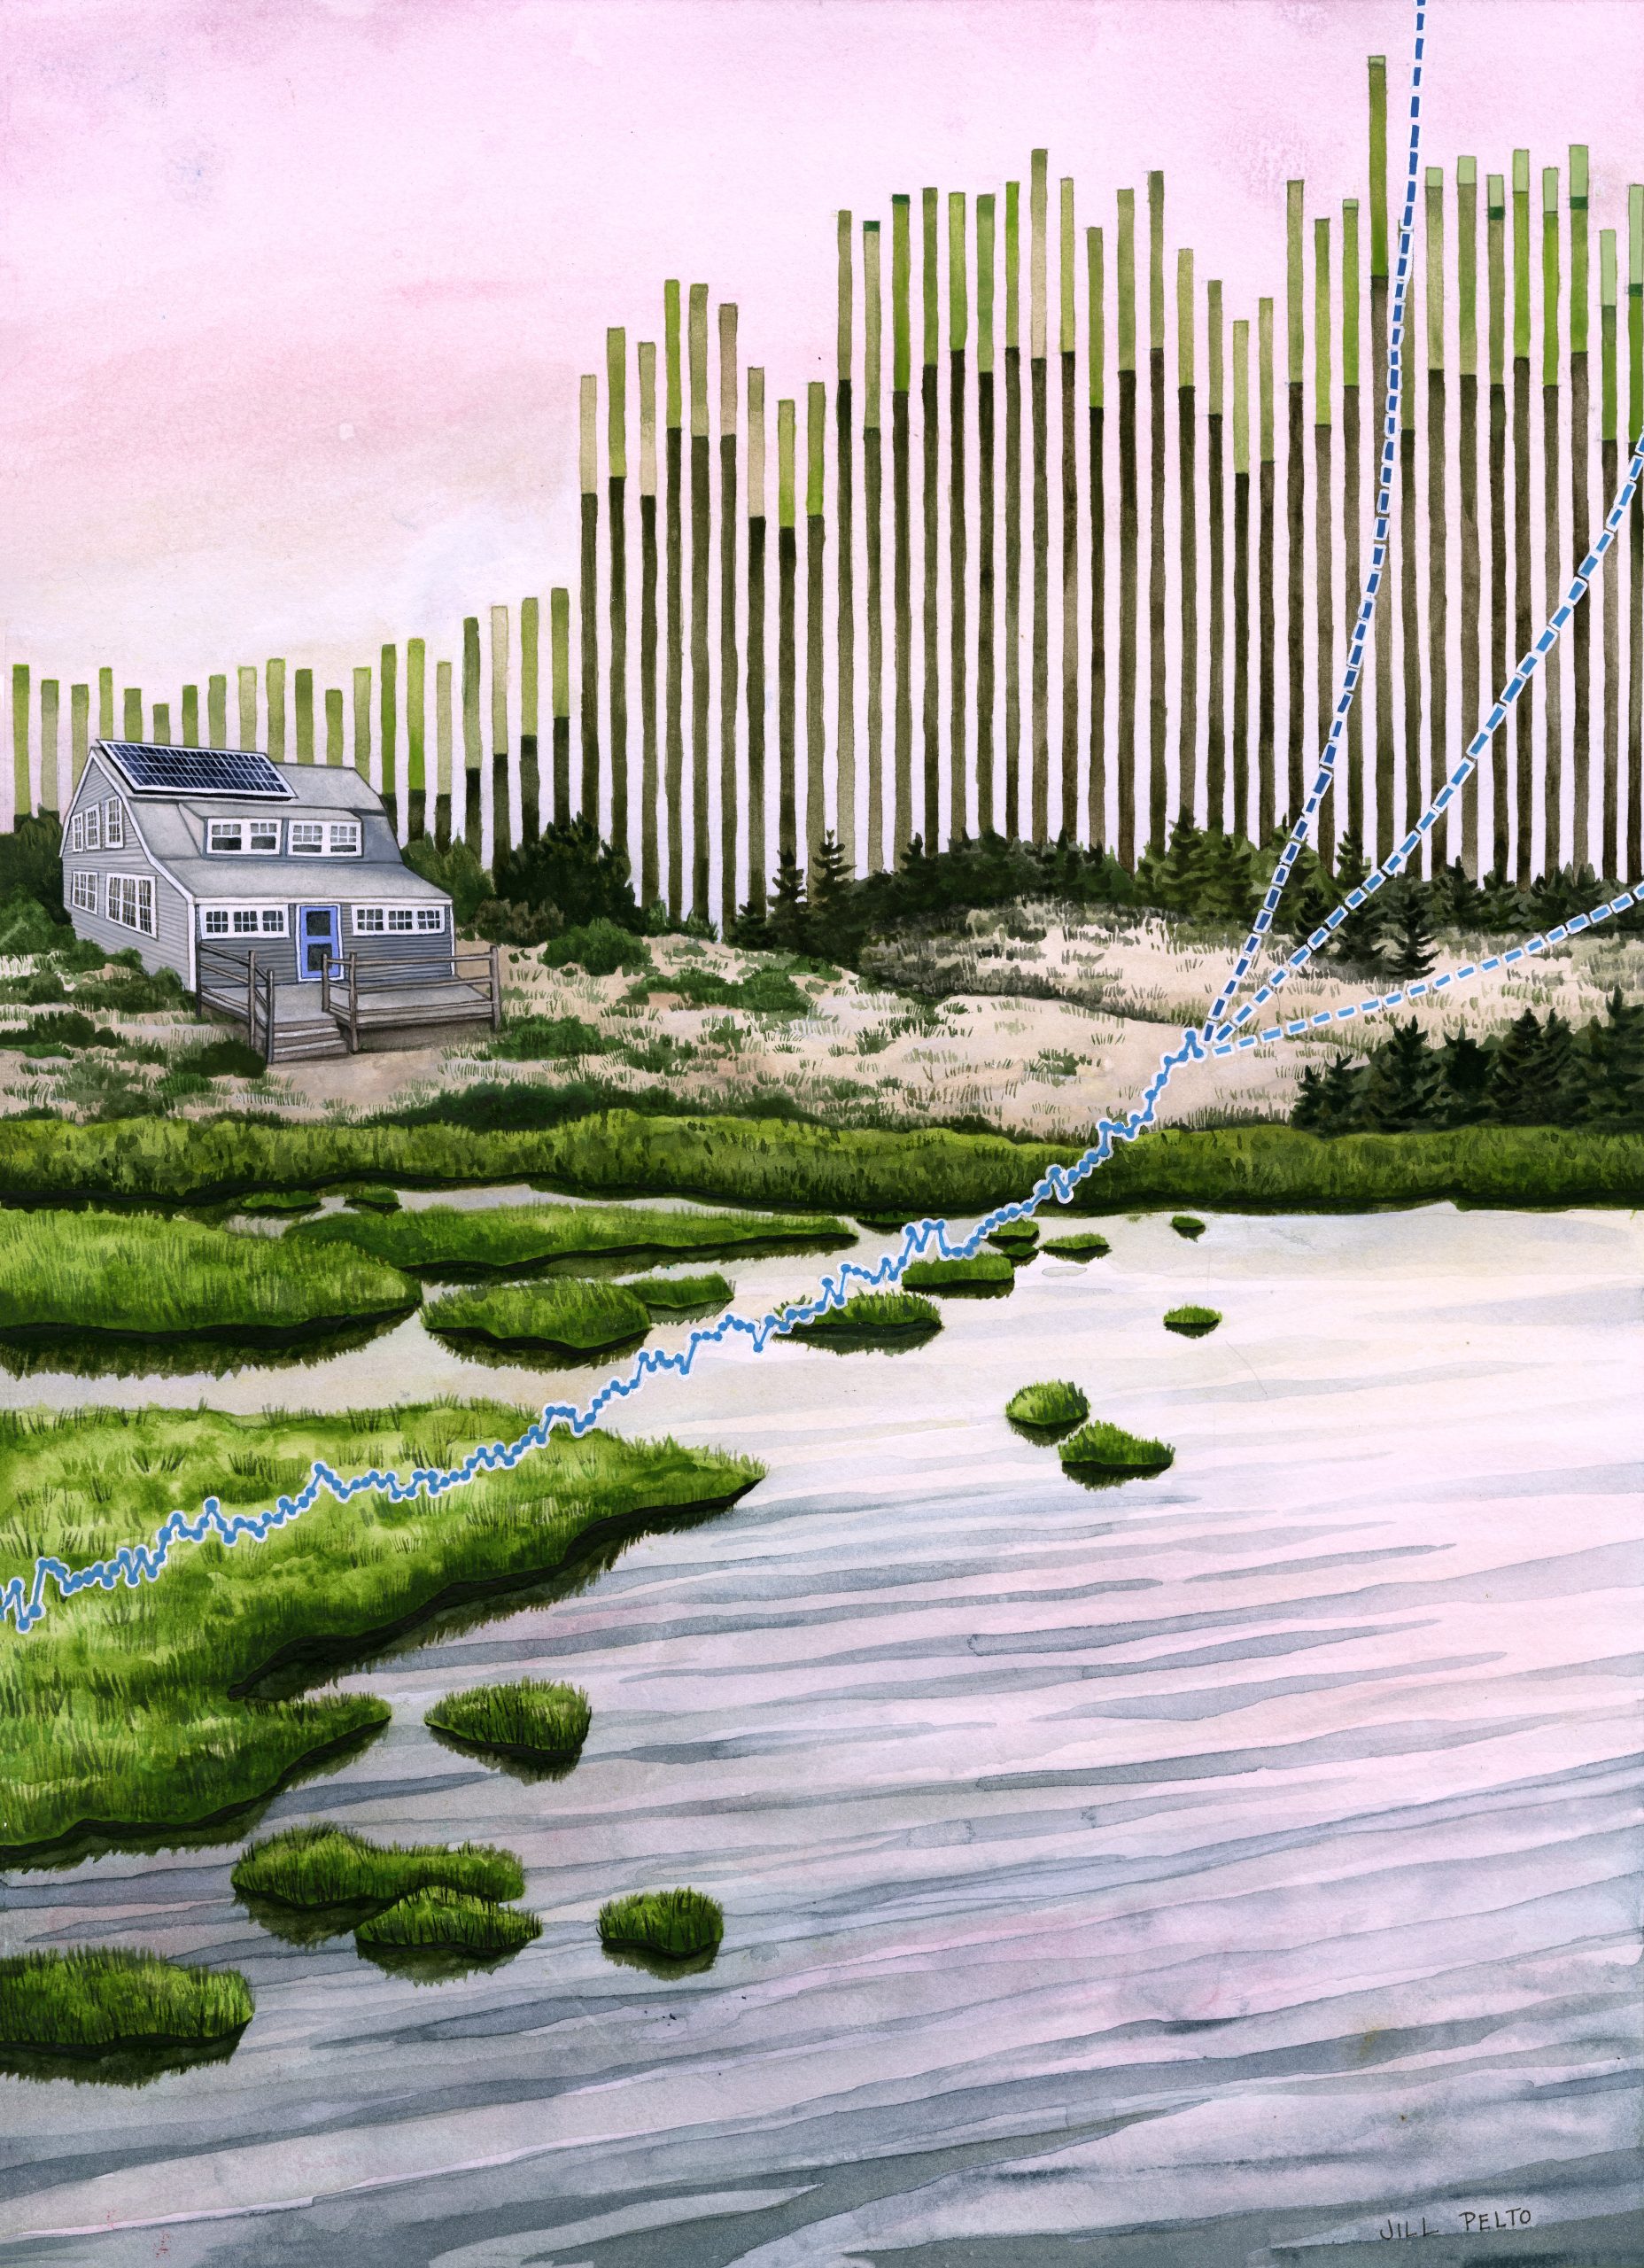
Departing from graphical approaches, such as bar graphs, pie charts, and scatter plots, artists have foregrounded emotion, affect, perceptual experience, and metaphor to produce memorable, divergent data visualizations. These data visualizations include sculptural objects, two-dimensional works with pictorial elements, art installations, kinetic art, performances, and sound art. Within this broad category of data visualization, eco-visualizations represent a subset of data visualizations that communicate trends and patterns in ecological, environmental, and sustainability data (Holmes, 2007). With sea levels projected to rise further, these works make these levels visible and point toward the impacts for more-than-human communities. Other artists have attended more to the specific height of future sea levels by focusing on measurement and attending to specific projections.
Source: The Guardian August 08, 2023 21:13 UTC