


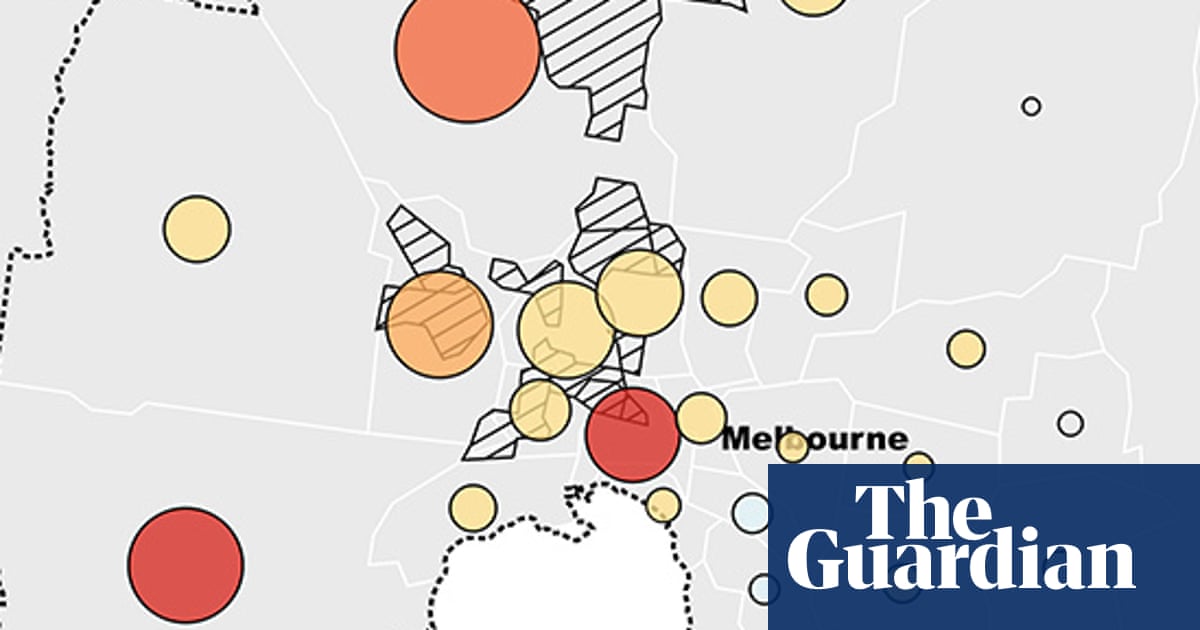
Victoria and Melbourne Covid trend map: where coronavirus cases are rising or falling
A Guardian Australia analysis of coronavirus cases in Victoria shows where infections have been increasing, and where Covid-19 cases are on the decline. Here’s the full map:Where Covid-19 cases are increasing and decreasing in Melbourne Showing the trend in reported cases by local government area, for areas with more than five cases in the past fortnight. Data last updated: Trend in cases* Total recent cases Areas Zoom to Victoria Toggle postcodes Toggle map circlesThe map is updated daily to track changes in each area over time. Please let me know if there are any issues with the map or data here: australia.coronatracking@theguardian.comMore Victoria Covid-19 data and mapsBelow you can find all our Victorian coronavirus data, which is also available on our full Australia Covid-19 map and stats page. This chart shows the percentage of positive cases per the number of tests conducted for both Victoria and NSW.
Source: The Guardian August 20, 2020 21:33 UTC